

Co-Founder & Partner

Having assisted numerous supply chain teams with practical AI, I want to share an approach for identifying opportunities for your digital transformation roadmap. While this approach may not cover every aspect, it aims to ignite your creative thinking and inspire actionable insights.
Most organizations are already using data to make decisions. However, many times data is used to show past performance (dashboards, presentations), and business leaders use this information along with their domain knowledge to make decisions. Sometimes decisions are made using simple spreadsheet-based calculations, rules-based methods, or manual decision-making processes. ‘Simple’ in terms of math, not complexity. These are the areas to explore for opportunities.
Organizations can categorize their spreadsheet, rules-based models, or manual processes using two dimensions: 1) How critical (or rewarding) is the decision that is made using the model 2) How often is the model used. In the second dimension, try to estimate the use, if technology or users’ skills weren’t a barrier.
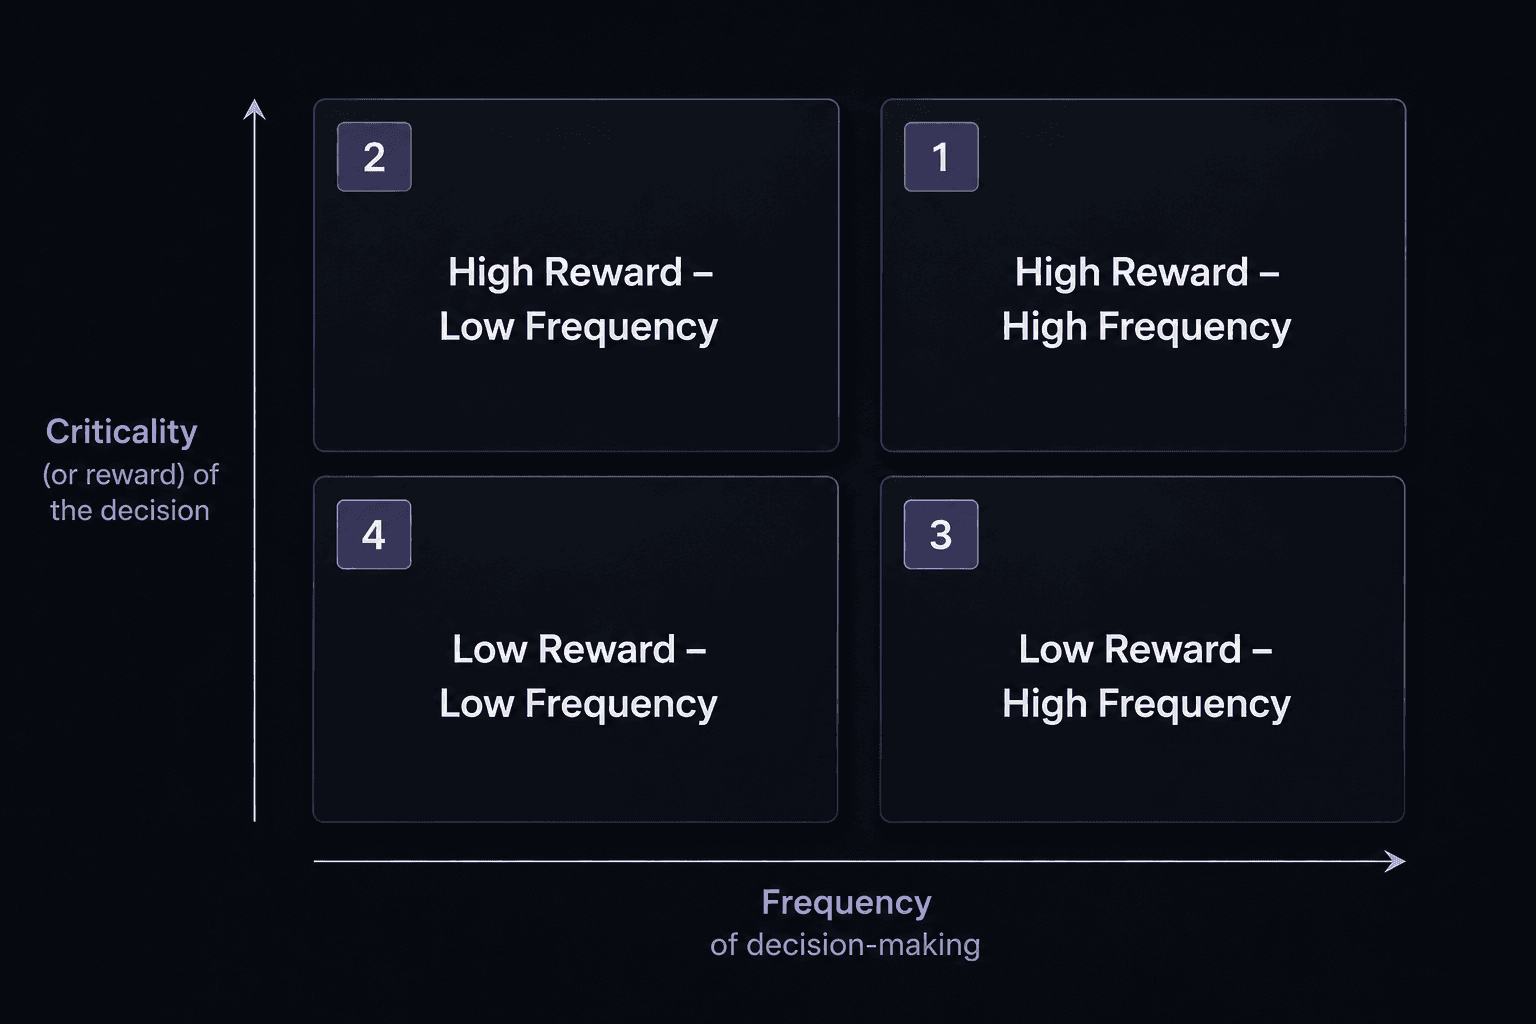
Based on these dimensions, organizations can create the following four categories:
High Reward – High Frequency
By improving the science and ease of use of these models, organizations aren’t only making better decisions, but also doing it with much fewer work hours. This will enable your organization to adapt faster to changing business environments and reduce the likelihood of errors. Retail organizations doing inventory planning could be an example use-case. Dynamic load building and truck routing is another example that fits this category.
High Reward – Low Frequency
By improving these models, organizations can generate greater business value; however, in terms of priorities, focus on an algorithmic approach, more than ease of use. Example use-cases would be strategic supply chain network design, and static routing to deliver loads to stores.
Low Reward – High Frequency
By improving these models, organizations can improve productivity and agility in a changing environment. Focus more on ease of use and change management than algorithms so that applications have a high adoption rate. Organizations doing inventory rebalancing across their network could be an example use case. Another example could be workforce planning at fulfillment centers to find the right balance between cost and service levels.
Low Reward – Low Frequency
These have the lowest priorities. These use cases might be projects to keep building momentum for your entry-level data scientists. Many ad-hoc spreadsheet analyses would fit in this bucket. Having access to the right data sources for these analyses would provide the most value.
Once you have identified project opportunities, the next step is to improve the decision-making with the use of advanced analytics. My general approach is to first understand the current decision-making process before designing any solution. If an organization is using MS Excel or rules-based models to make business decisions, look for the following two functions.
Average: In my opinion, many of these ‘Average’ calculations can be an opportunity to improve the model using a predictive model. For example, planners might be using average worker productivity to estimate fulfillment centers’ workforce requirements in the upcoming weeks. In reality, workers’ productivity will be influenced by many factors, including the number of orders, the type of products, the number of units per order, etc. A more sophisticated approach to predicting labor productivity would greatly enhance the accuracy of the plan, helping fulfillment centers to achieve their financial and service goals.
Sort: A real business problem will have a lot of complex relationships among many factors. In a simple model, decision-makers often ignore this complexity and focus on a few factors. Many times, decisions are made by just sorting the most important factor or two. This could be a sign of a need for an optimization model.
We built an optimization model for a large automobile manufacturer to assign carriers to lanes while minimizing total transportation cost on a daily basis. This model makes sure that carriers’ contracts are respected on a rolling basis while considering carriers’ capacities and rates. Before this model, our client’s team was using a spreadsheet model and making this decision by sorting the cost column and assigning lanes to the cheapest carriers one by one while tracking the contractual obligations separately. This project reduced outbound transportation costs by 5%.
Remember that digital transformation is a journey, and simply implementing software applications won't guarantee success. Develop a comprehensive roadmap creation process that extends beyond common AI applications. Engage with your organization's stakeholders and teams, seeking their input and fostering a culture of data-driven decision-making.
How is your organization creating a project roadmap? Are you experiencing a need to do AI projects but don’t know where to start? We would love to hear your thoughts.


Subscribe
Subscribe for fresh perspectives in supply chain and advanced analytics.